
Scale Revenue Without Scaling Ad Spend
How to Unlock 20–40% More Revenue by Optimizing What Happens After the Click
At some point in every growth journey, scaling ads stops being the smartest play. CPCs rise. Margins compress. And yet, most brands still pour more budget into campaigns that are already leaking revenue downstream. The smarter move is unlocking growth not by buying attention, but by earning conversion. This is where post-click optimization drives breakthrough performance—often unlocking 20–40% more revenue from the same traffic.
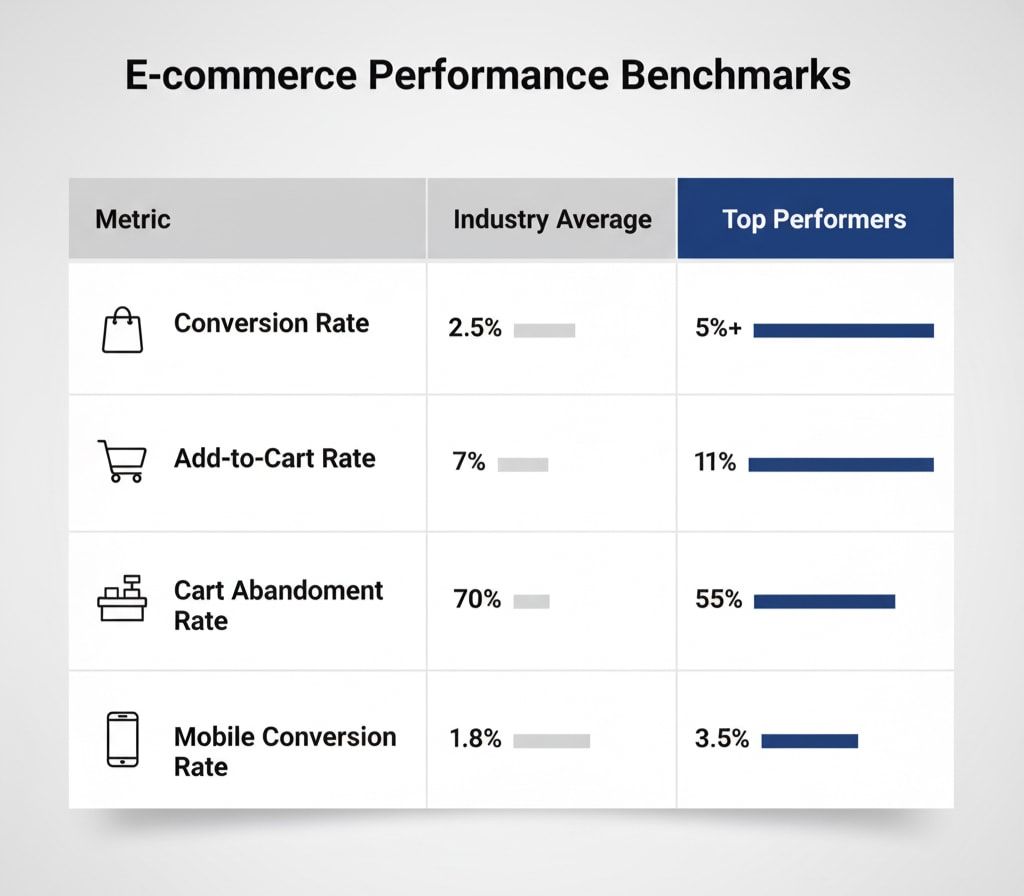
Optimizing what happens after the click is how you turn every visitor into a better opportunity without any new campaigns or bigger budgets. The global average e-commerce conversion rate hovers between 2% and 4%, meaning 96-98% of traffic goes to waste. But leading brands have discovered that tactical improvements across three key areas—first impressions, friction reduction, and continuous testing—can reclaim massive revenue from existing visitors.
Fix the First Impression
Above-the-fold clarity wins. You have about three seconds to prove relevance, value, and trust before a potential buyer scrolls or bounces. In those moments, visual clutter and vague copy quietly erode performance. Research shows that 57% of user attention is spent above the fold, and trust-building elements placed in this zone can drive up to 42% improvement in conversion rates.
Your hero section should work like a billboard: instantly communicate your value proposition, the primary outcome for the visitor, and one clear call to action. Replace complex or clever copy with direct clarity. "Shop sustainable skincare that works" converts far better than abstract words about "wellness" or "self-care." Compress your headline, subtext, and CTA into a tight, visual story that tells users exactly what they gain and what to do next.
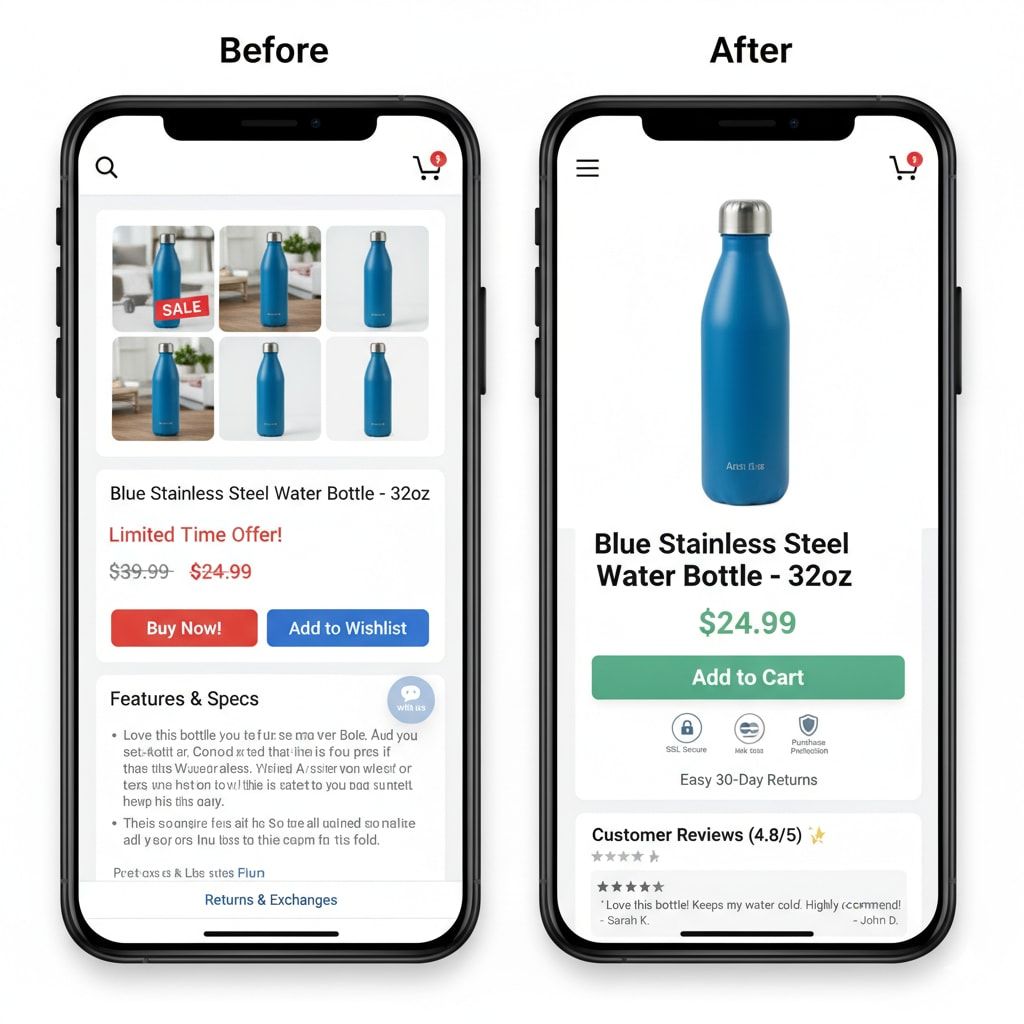
Every design choice above the fold should support that one job—help users see value and feel confidence immediately. Remove rotating banners, avoid multiple CTAs competing for clicks, and use social proof right where users look first—ratings, reviews, or recognizable media mentions. This small shift can double engagement before the scroll even begins.
Reduce Friction Across the Funnel
Even the best traffic fades to waste if your funnel feels like hard work. Reducing friction starts with understanding shopper intent at every stage and aligning the experience to make buying effortless. With an average cart abandonment rate of 70-76% globally, and checkout abandonment hitting 60-80%, every micro-friction point destroys revenue.
Product Discovery: Filters, Search, Smart Ranking
Filters, search, and sorting should mirror how people actually shop. Use intent signals—recent searches, bestsellers, or contextual filters—to surface relevant items faster. When shoppers instantly find what they want, session value climbs and bounce rates fall. The average add-to-cart rate across e-commerce is only 6-7%, meaning fewer than 1 in 15 visitors even express purchase intent.
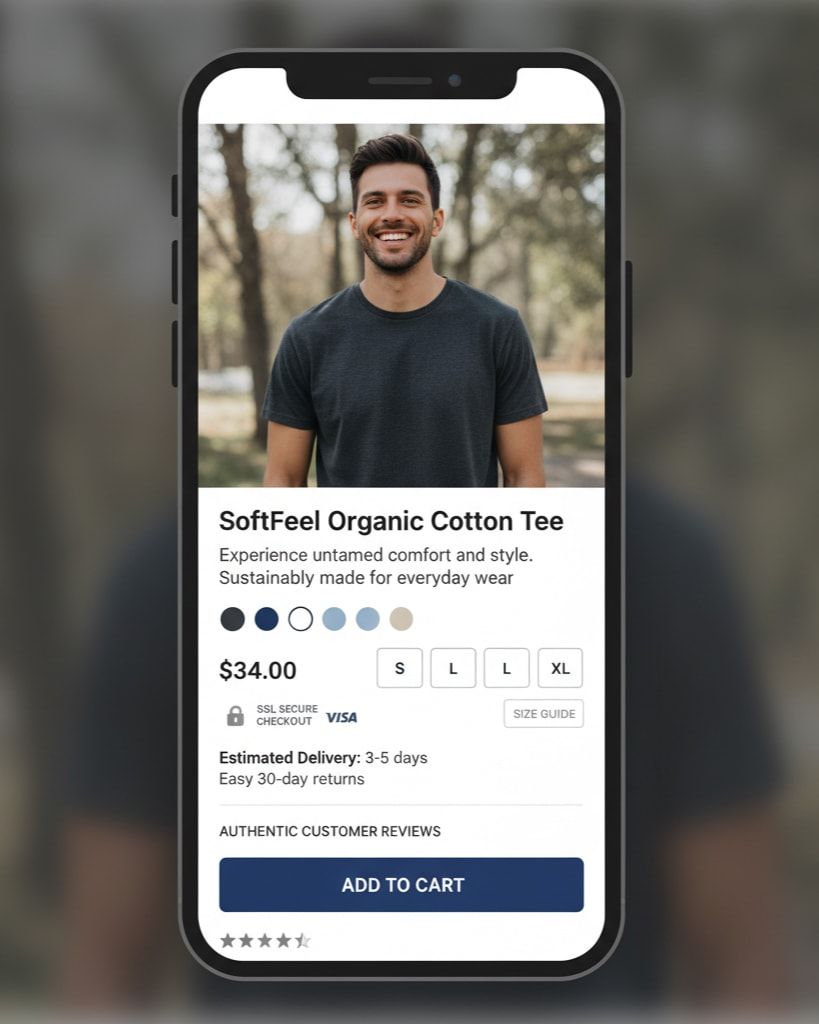
Product Detail Pages: Hierarchy, Trust, and Clarity
These are the make-or-break point in the buyer's decision. Structure content hierarchically so the essentials come first: value, proof, and action. Clarify product options (size, color, quantity), emphasize trust signals (secure payment, easy returns), and make shipping information obvious without hiding it behind clicks. Simple improvements like a clear sizing chart or delivery estimate can lift add-to-cart rate dramatically. The typical add-to-cart rate is 7%, but optimized PDPs achieve 9-11%.
- Flos USA added visual color swatches to their "Choose Finish" option on product pages, reducing uncertainty about variations. Combined with streamlined cart and checkout improvements, they achieved a 125% increase in checkout conversion rates and an 18x ROI.
- Glossier launched 24 customized shopping experiences in 8 months using targeted post-click experiments, achieving up to a 65% ROAS lift by aligning ad creative with specific product page experiences.
- Displaying customer reviews on product pages increases conversion rates by 30%.
- User-generated content (UGC) on PDPs can boost engagement and conversion by 18-20%.
Cart Review: Reassurance Over Surprise
This stage is about reassurance, not surprise. Use this screen to restate guarantees, show incentives like free shipping thresholds, and keep totals transparent. Reduce visual clutter and reinforce urgency subtly—limited-time offers or low-stock indicators—without overwhelming the buyer.
- 59% of Indian consumers cite hidden fees at checkout as the primary reason for cart abandonment.
- Transparent pricing displayed early reduced cart abandonment by 17% for a D2C electronics brand.
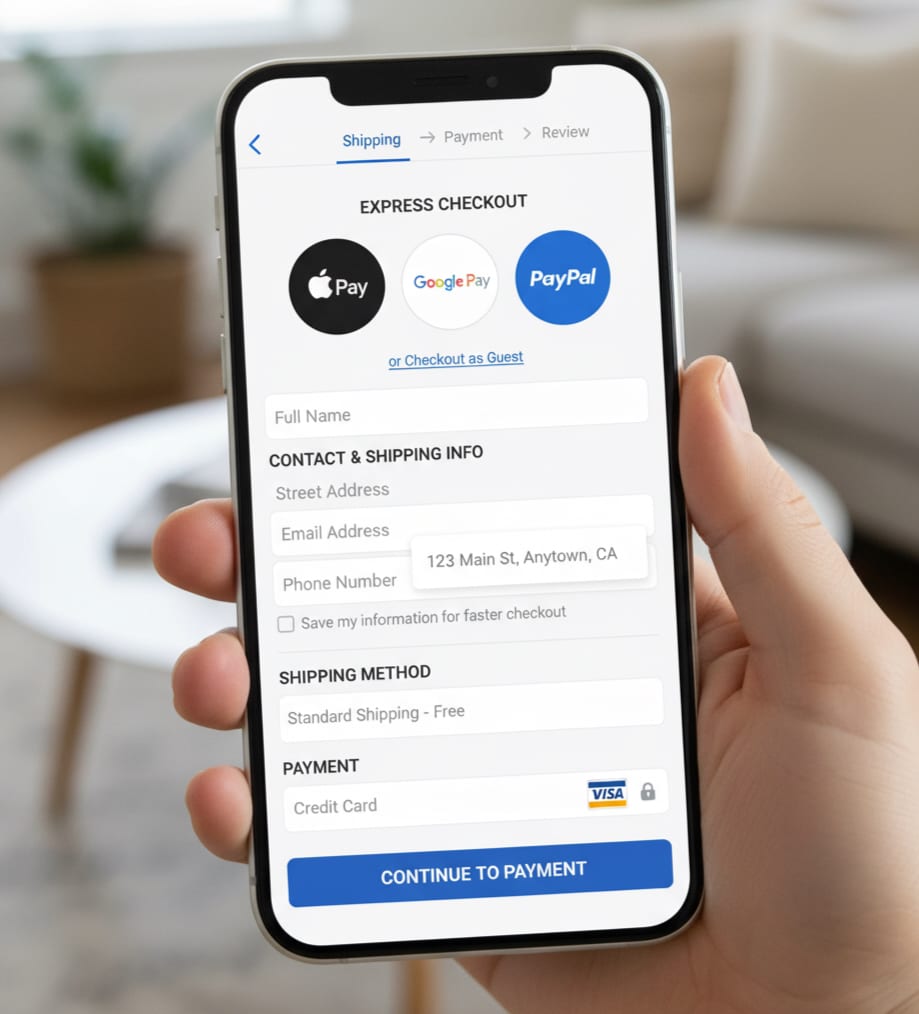
Checkout: Fewer Fields, Fewer Errors, Zero Surprises
The finish line must be smooth. Every extra field, error, or uncertainty creates hesitation. The average checkout abandonment rate sits between 60-80%, largely due to overly complex flows. Automatically detect location for address fields, enable one-click payment or wallet options, and eliminate unnecessary steps like forcing account creation. Aim for fewer fields, fewer errors, and zero last-minute surprises.
- Mobile checkout optimization is critical: mobile cart abandonment rates reach 79% versus desktop's 68%.
- Desktop conversion rates average 3.9-4.8% while mobile lags at 1.8-2.9%, despite mobile commanding 73% of traffic.
Prove It Continuously
Sustainable optimization isn't a one-time project. It's a continuous loop of measurement, learning, and improvement. The most successful e-commerce operators don't guess—they test. 82% of marketers find CRO challenging, making systematic testing your competitive advantage.
Start A/B testing where impact is highest: homepages, product listing pages, product detail pages, cart, and checkout templates. These are your high-traffic, high-leverage zones. Run concise, fast experiments with clear hypotheses—what you expect and why. Measure using weekly lift, not perfectionism in statistical models. Move quickly, document learnings, and redeploy wins across the rest of the funnel.
- Indochino created editorial-style landing pages aligned with Facebook ads, achieving 17.4% conversion rate across 64,000 visitors. Their location-specific page for Washington D.C. hit 19.38% conversion. Within nine months, they booked over 800 showroom appointments without increasing ad spend.
- Marketview Liquor ran A/B tests on product page variations, achieving an 18.2% lift in add-to-cart rate for one variation and 16.9% for another—both reaching 99% statistical relevance.
- ACT Fibernet (India) used city-level and keyword-based personalization on landing pages, achieving a 25% increase in customer acquisition, a 12% lift in overall conversion rates, and a 6% higher conversion rate on CTAs.
Example Results
- +28% checkout completion after streamlining address and payment steps (Flos USA: +125%)
- +17% higher add-to-cart rate by clarifying sizing and shipping info on PDPs (Marketview: +18.2%)
- +11% increase in average order value through smart bundles and progressive incentives
- Average global e-commerce conversion rate: 2-4%
- Average add-to-cart rate: 6-7% (top performers: 9-11%)
- Average cart abandonment: 70-76% (optimize to recover 5-10%)
- Email marketing conversion rate: 10.3% (highest converting channel)
- Bundles and upsells can increase AOV by 10-20%
Conclusion
Scaling revenue doesn't always mean scaling ad spend. The next step change in performance often lives in how efficiently existing traffic converts. By fixing the first impression, removing friction across the funnel, and running continuous A/B tests, brands unlock trapped value within their own experiences.